


Latino or Hispanic business owners capitalized on economic opportunity between 2017 and 2022, creating thousands of firms that benefited the communities they serve. In 2022, Latino or Hispanic individuals owned 7.9% of all employer businesses (those that employ at least one person)—a total of 465,202 firms.
Employer businesses are often community anchors that local governments and individuals rely on as engines of economic growth and employment hubs. In 2022, Latino or Hispanic-owned businesses employed 3,550,230 people and generated over $653 billion in total revenue—an increase of 14.1% and 18.9%, respectively, since 2021. This growth represents real and positive change, mirroring strong overall growth for minority business owners, which helped communities weather economic uncertainty, including the COVID-19 economic downturn.
But Latino or Hispanic individuals are still underrepresented as employer business owners compared to their share of the U.S. population. As mentioned above, Latino or Hispanic-identifying individuals owned 7.9% of employer businesses in 2022, despite comprising 19.1% of the population. In contrast, and as we’ve identified in previous reports, white Americans are overrepresented, representing 81.1% of all employer business owners yet only 74% of the U.S. population.
As this report demonstrates, growth in Latino or Hispanic-owned businesses hasn’t come at the expense of other race or ethnic groups; it has been additional, and there’s still room to grow. If the share of Latino or Hispanic-owned employer businesses equaled the share of Americans who identify as Latino or Hispanic, there would be 812,440 more businesses generating a combined $1.1 trillion in revenue and $250 billion in payroll.
This report, the second in the Center for Community Uplift’s series on Latino or Hispanic-owned businesses, analyzes Annual Business Survey (ABS), American Community Survey (ACS), and Bureau of Economic Analysis (BEA) data from 2017 to 2022 to understand recent trends for these firms. We find that:
- Latino or Hispanic-owned businesses have grown at an average annual rate of 7.7%, surpassing the 0.46% growth rate for all employer businesses.
- Between 2017 and 2022, Latino or Hispanic-owned businesses grew in 204 of 227 (89.9%) U.S. metro areas.
- Despite this growth, Latino or Hispanic-owned businesses are underrepresented compared to their share of the population in most metro areas—demonstrating the potential for economic growth and job creation that could stem from supporting these business owners.
- While most of this business growth can be explained by a strong post-pandemic economy, federal and state policies may have also driven growth.
Despite being underrepresented, Latino or Hispanic employers supported local economies across the US, particularly in small and midsized cities
In 2022, 19.1% of the American population (63.5 million people) identified as Latino or Hispanic, representing a large, growing, and incredibly diverse demographic. Latino or Hispanic communities vary by race, immigration status, migration timing, cultural background, and indigeneity. This diversity means that generalization can obscure the types of barriers the community faces in starting and growing a business. In reality, factors such as access to intergenerational wealth and resources can vary substantially between race and place, and influence the picture of opportunity at the regional and metro area level.
In cities across the country, Latino or Hispanic businesses represent large shares of local economies. As Map 1 shows, the cities with the highest shares of Latino or Hispanic-owned employer firms are concentrated in Southwestern and Floridian cities with large Latino or Hispanic-identifying populations. Of the 10 cities with the highest share of Latino or Hispanic-owned employer business, the top six are in Texas.1 There and in other states, including New Mexico and Arizona, Latino or Hispanic-owned businesses represent large segments of relatively small economies. In El Paso and Laredo, Texas, for example, Latino or Hispanic-owned employer businesses represent 50% or more of total employers.
Latino or Hispanic employers are also large components of dense, racially and ethnically diverse economies. This includes Washington, D.C., Chicago, New York, Houston, and Los Angeles. Miami—a historic hub of Cuban cultural heritage—had close to 60,000 Latino or Hispanic-owned businesses in 2022, the largest number of any metro area, exceeding totals for New York and Los Angeles.
Yet even in midsized and large Latino or Hispanic-majority cities where Latino or Hispanic-owned businesses represent a large component of total businesses, these business owners are still underrepresented. For example, in El Paso, Texas, where 55% of employer businesses are Latino or Hispanic-owned, there are close to 1.6 times more Latino or Hispanic-identifying residents (83% population share). Similarly, in Yuma, Ariz., 66% of the population identifies as Latino or Hispanic, but only 28% of employer business owners do. While in general, cities with higher shares of Latino or Hispanic residents tend to have higher shares of Latino or Hispanic-owned employer businesses, Figure 1 shows that even in these cities, these owners are underrepresented.
Figure 1

In three cities—Dublin, Ga., Greeneville, Tenn., and Decatur, Ill.—the share of Latino or Hispanic business owners is greater than the proportion of Latino or Hispanic-identifying residents. However, these cities are exceptions rather than the rule, and have relatively small Latino or Hispanic populations.
Despite modest business growth nationally, the number of Latino or Hispanic-owned businesses has grown
Despite disparities with population shares, Latino or Hispanic business ownership is on the rise. Between 2017 and 2022, the number of Latino or Hispanic employers increased by 44.4% (see Figure 2). Just between 2021 and 2022, the number of Latino or Hispanic employers increased by 14.6%, to a total of 465,202 employer businesses nationally. This growth eclipses overall employer business creation, which grew by just 0.46% annually and 2.3% overall during this period.
Figure 2

Latino or Hispanic employers’ growth rate was the third-largest compared to other major racial and ethnic groups. Figure 3 shows that the number of non-Latino or Hispanic Native American-owned businesses increased by 93.9% and non-Latino or Hispanic Black-owned businesses increased by 56.9%. The number of Native Hawaiian and Pacific Islander employers increased by 39.5%, and the number of Asian American employers increased by 17.1%. Employer businesses owned by white Americans declined slightly, by 0.1%.
Latino or Hispanic employers made significant contributions to jobs, wages, and revenue
Despite being underrepresented nationally, recent research shows that Latino or Hispanic-owned businesses were a substantial component of post-pandemic business creation. These businesses likely buffered the economy against a more severe downturn in 2020, and have helped foster strong economic growth since. From 2021 to 2022, Latino or Hispanic-owned businesses represented 58% of the increase in total employers. Without these businesses, between 2019 and 2022, the U.S. would have had 619,655 fewer jobs—a loss of $34 billion in workers’ wages and $190 billion in total revenue.
Figure 3

Arguably more important than business formation are indicators of businesses success, including total revenue, employees, and how much those employees are paid (measured here by annual payroll). Figure 4 shows that these indicators were variable for Latino or Hispanic-owned businesses. From 2018 to 2019, for example, the number of employees at Latino or Hispanic-owned businesses decreased by over 42,000. Yet strong growth between 2020 and 2022 reversed this decline, making up for the previous loss 15 times over. Similarly, while total wages decreased in 2019 alongside the decline in employees, this also rebounded from $105.6 billion in 2020 to $143.3 billion in 2022.
Figure 4

The construction industry has boomed for Latino or Hispanic business owners, but other industries have also surged
In terms of industry composition, Figure 5 shows that Latino or Hispanic employer businesses were clustered in construction, accommodation and food services, and professional and technical services, which comprised 18.8%, 12.3%, and 10.9%, respectively, of Latino or Hispanic-owned businesses by sector.2 In contrast, the top three industries for all employer businesses were professional and technical services (19.2%), construction (15.1%), and retail trade (12.2%).
Figure 5

From 2017 to 2022, these industries grew substantially for Latino or Hispanic employers. For example, Figure 6 shows that the number of Latino or Hispanic-owned businesses in construction increased by over 37,500 (a 75% increase). While almost all industries have seen some increase in Latino or Hispanic employers (aside from agriculture, forestry, fishing, and hunting, which saw a 38.5% decrease), the other top-growing industries were in the arts, entertainment, and recreation (86% growth), transportation and warehousing (74%), and real estate and rental leasing (66%).
Figure 6

Latino or Hispanic-owned businesses have grown across almost all metro areas
Across the 251 metro areas that were surveyed at least twice between 2017 and 2022, Map 2 shows that in 204 (89.9%) Latino or Hispanic-owned businesses have grown. This growth has been particularly pronounced across the Midwest and parts of Southern Appalachia. Smaller metro areas in those regions—including Lawton, Okla., Spartanburg, S.C., and Fond du Lac, Wis., have seen over 1,000% increases. This partially reflects the fact that these areas started with smaller numbers of Latino or Hispanic-owned businesses in 2017.
In terms of the number of Latino or Hispanic-owned businesses (also shown on Map 2 by hovering over a metro area), the largest growth occurred in metro areas with large Latino or Hispanic communities. This includes Miami (13,693 new businesses; 29.9% gain), Los Angeles (10,999 new businesses; 39% gain), and New York (8,727 new businesses; 29.3% gain). Cities that have experienced tremendous population growth—including Phoenix, Houston, and Dallas—also saw substantial increases in the number and percentage of Latino or Hispanic-owned businesses.
Map 2

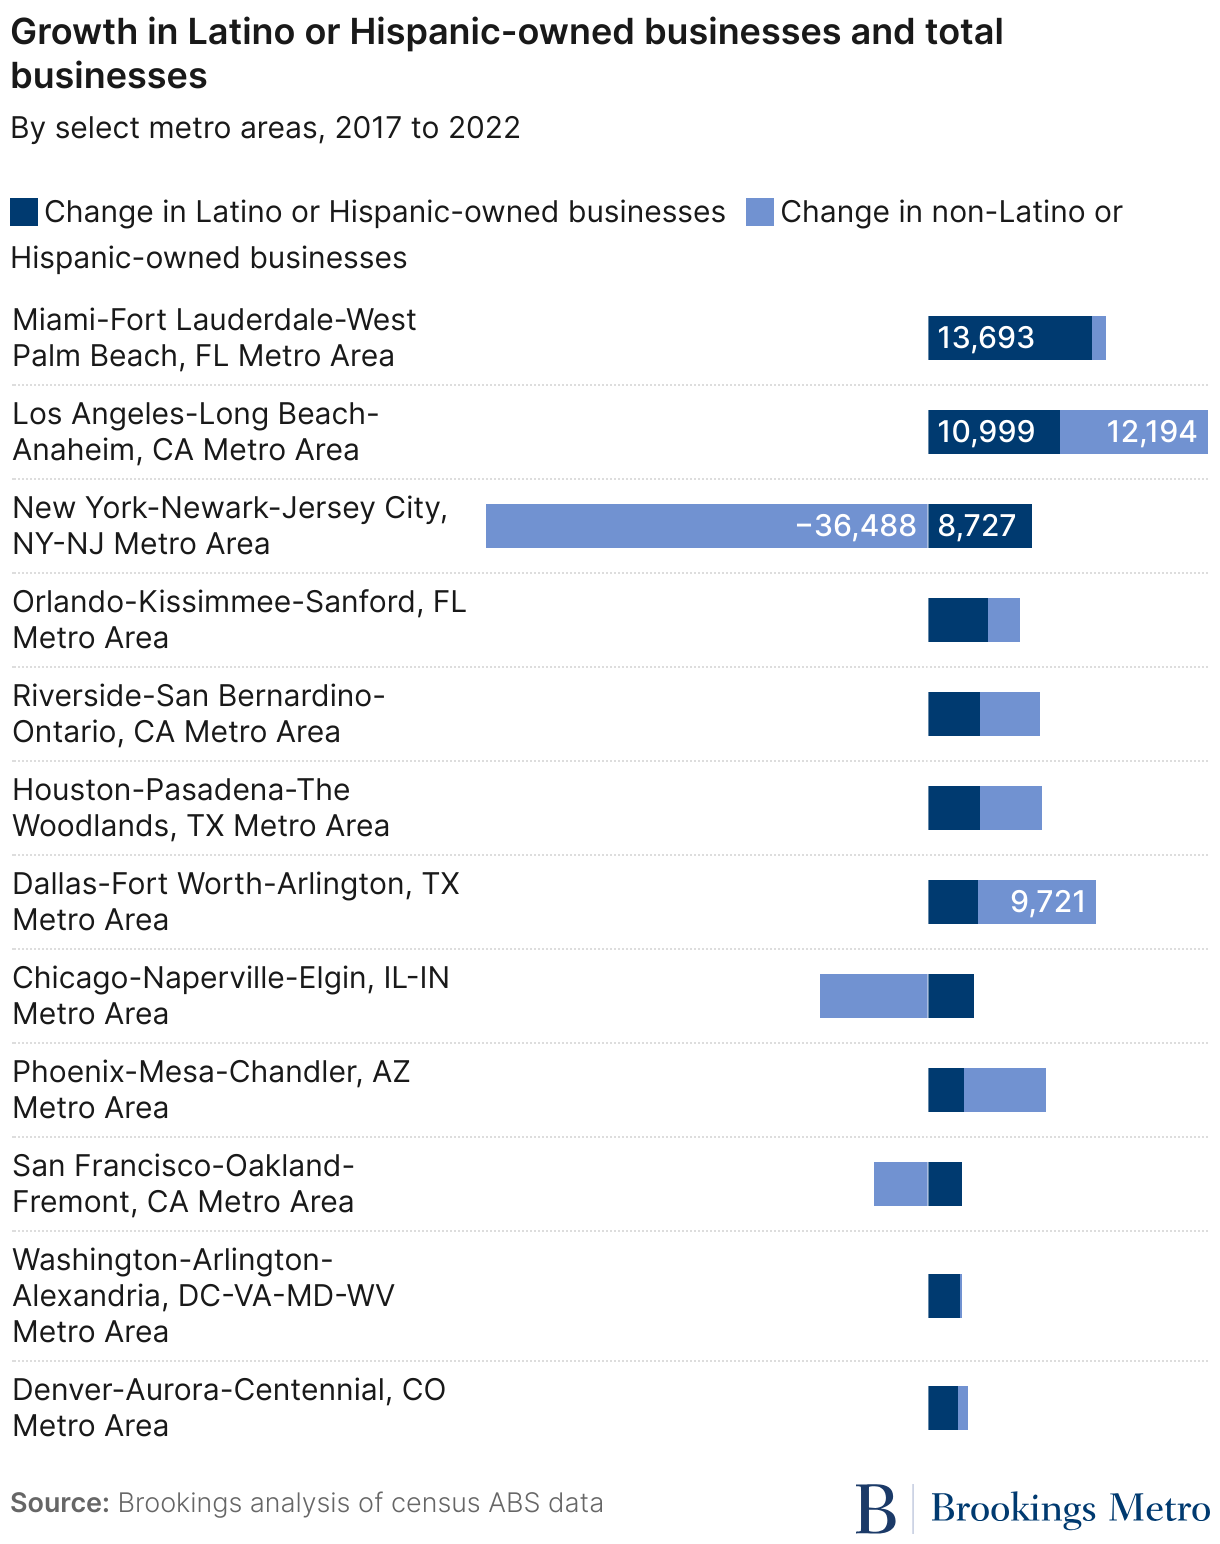
In many of the top-growing metro areas, Latino or Hispanic-owned businesses contributed substantially to overall business growth. Figure 7 displays the change in Latino or Hispanic-owned businesses compared to non-Latino or Hispanic businesses. It shows that Latino or Hispanic businesses represented over 93% of total growth in Miami; 47% of total growth in Los Angeles; and 65% of total growth in Orlando, Fla. In New York, where total businesses declined over the period, Latino or Hispanic-owned businesses increased by 8,727, reducing the total decline by 23.9%.
Figure 7
Latino or Hispanic-owned business have benefited from a strong economy, but national policies may have also had a positive impact
To better understand if the growth in Latino or Hispanic-owned businesses is a result of a more opportunity-rich business environment for underrepresented groups, this report analyzes macroeconomic trends alongside business growth.
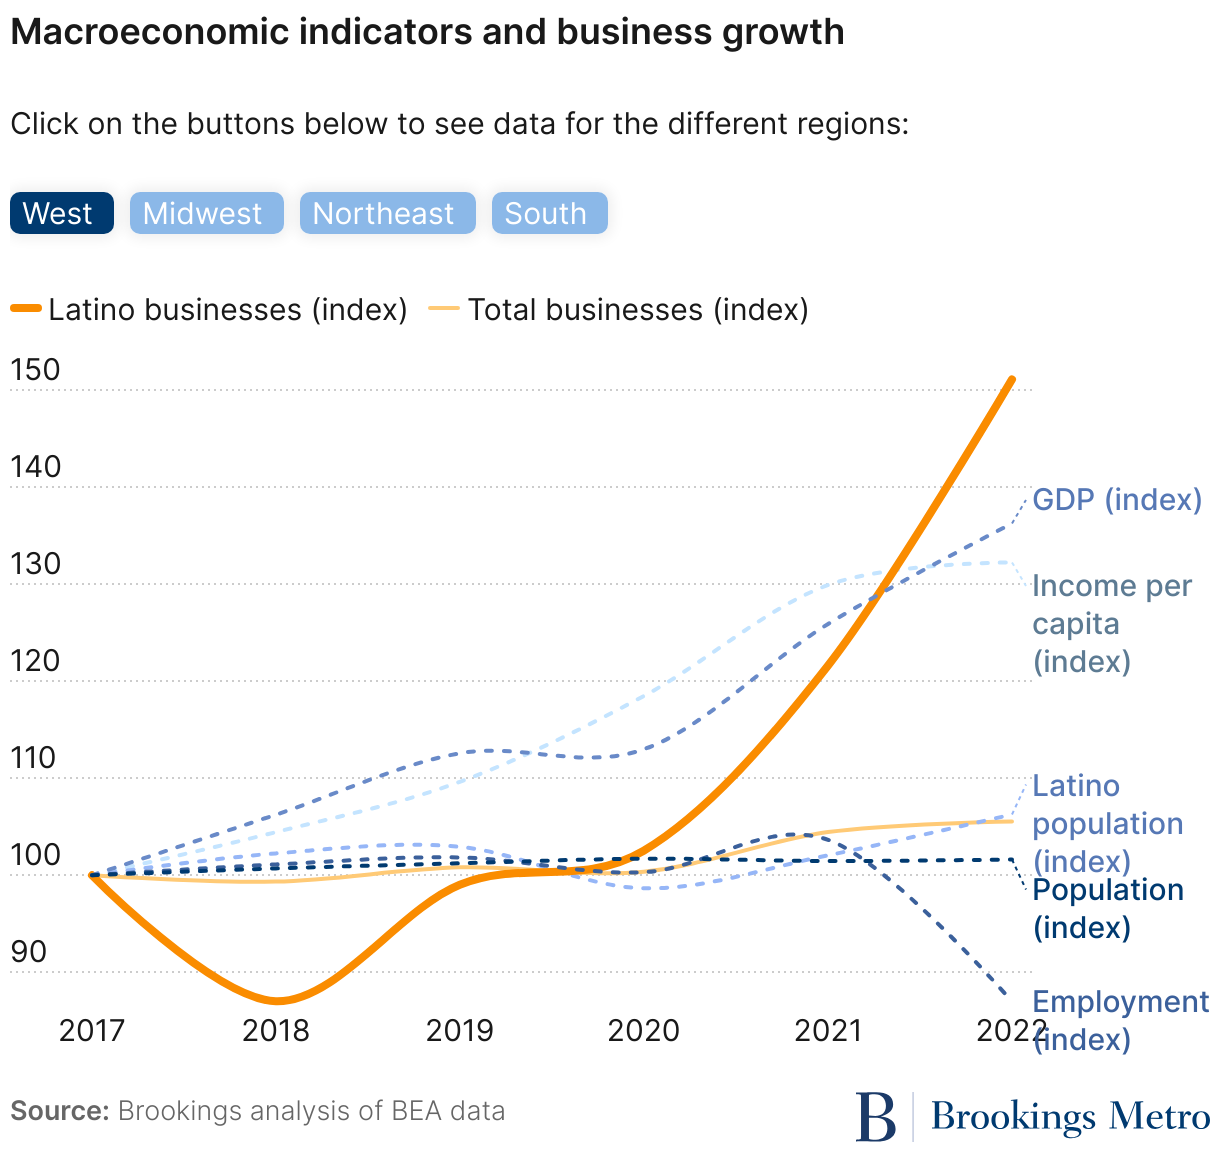
Figure 8 shows the growth in Latino or Hispanic-owned and total businesses compared to gross domestic product (GDP), total employment, population growth, and income per capita (indexed to 2017 values). Together, these variables indicate the “health” of local and regional economies. Because business creation typically follows patterns of economic growth and decline, by examining these indicators alongside Latino or Hispanic-owned business growth, we can start to assess whether policy changes aimed at improving access for Latino or Hispanic and other groups have also had a positive impact on growth.
For Latino or Hispanic and other underrepresented demographics who have less access to intergenerational wealth and are more likely to use personal finances to start a business, policy change is crucial to level the playing field when it comes to business creation. The Biden-Harris administration introduced policies to advance racial equity, including expanding funding for disadvantaged business owners and investing billions to subsidize business development in historically disadvantaged communities. With Latino or Hispanic and other racial and ethnic minority-owned businesses growing at rates well beyond national growth, these and other policies may have helped drive a more equitable business environment by lowering barriers to accessing capital and supporting a vibrant industry of mission-driven investors.
Figure 8 shows that while regional trends varied from 2017 to 2022, Latino or Hispanic business growth generally followed GDP and per capita income, particularly from 2019 onward. Though lagging in 2020, GDP and per capita income surged in 2021 and 2022, demonstrating that Latino or Hispanic-owned businesses benefited from a strong post-pandemic economy in a way that businesses overall did not.
Figure 8
However, this trend analysis misses micro dynamics such as local industry composition, which influence economic conditions at the metro area level. To control for local effects, Figure 9 reports the outcomes of a regression analysis of these variables against the growth in Latino or Hispanic-owned businesses.3 The chart shows the average percentage of growth in total and Latino or Hispanic-owned businesses within metro areas that is explained by metro-level economic health.
For example, in metro areas in the Midwest and Northeast, Latino or Hispanic business growth more tightly mimics metro-level economic health than overall business growth does. This likely means that Latino or Hispanic business growth in these places is more sensitive to local economic shifts, which could be due to smaller firm sizes, lower capital buffers, and a greater dependence on the local economy. In contrast, Latino or Hispanic business growth is less sensitive to local economic conditions in the South. For example, in Southern cities like Atlanta, economic conditions only explain an average of 34.5% of the growth in Latino or Hispanic-owned businesses and 21.9% of the growth in total businesses. This suggests a greater influence of factors not measured here, such as business and capital concentration in a smaller number of industries.
Figure 9

While macroeconomic conditions explain most of the growth in Latino or Hispanic-owned businesses, a substantial portion of growth is still unexplained. This indicates that policy changes aimed at creating opportunities for underrepresented communities could have helped facilitate the sharp increase in Latino or Hispanic-owned businesses visible in the data. If anything, this analysis is likely to overstate the role of economic conditions on business growth. As Latino or Hispanic-owned businesses are overrepresented in sectors highly sensitive to macroeconomic trends, including construction and food services, their growth may appear more correlated with economic conditions than is really the case.
Ultimately, further research is needed. While this analysis provides insights into the relationship between metro area economic health and business growth, it is worth noting that factors that could be driving Latino or Hispanic business growth are not accounted for due to a lack of disaggregated data (especially by industry). This limitation highlights the need for more granular data on Latino or Hispanic-owned businesses by sector. Future qualitative research could also assess Latino or Hispanic business growth in thriving metro areas across the U.S. to gain better insights into how local business dynamics and capital markets influence economic opportunity.
The federal government can drive a growth agenda by supporting Latino or Hispanic-owned businesses
The data in this report demonstrate the potential for economic growth and job creation that could stem from supporting Latino or Hispanic business owners. Particularly in the Midwest and Northeast, Latino or Hispanic-owned business show a significantly stronger correlation with local GDP, employment, and income than total businesses, and so are more vulnerable to economic downturns. This indicates that Latino or Hispanic business owners in these regions would benefit from policies that can support their growth whether economic conditions are strong or poor. Additionally, place-based business incentives in Latino or Hispanic-dense areas could help accelerate job creation and hiring.
Latino or Hispanic individuals constitute almost one in five Americans and represent one of the fastest-growing demographics in the country. They are making tremendous contributions to this nation’s economy, including by what they build and own. Supporting Latino or Hispanic entrepreneurs in policies and programs increases the potential for all regions and communities to benefit.
The Brookings Institution is committed to quality, independence, and impact.
We are supported by a diverse array of funders. In line with our values and policies, each Brookings publication represents the sole views of its author(s).