
With millions of people in the United States at risk of losing access to the federal Supplemental Nutrition Assistance Program (SNAP) – also known as food stamps – from November 1, a viral chart has claimed to show the majority of the nation’s food stamp recipients are non-white and noncitizens.
The chart, titled Food Stamps by Ethnicity, listed 36 groups of people and said it showed the “percentage of US households receiving SNAP benefits”.
Recommended Stories
list of 4 itemsend of list
The groups were labelled by nationality, such as “Afghan”, “Somali”, “Iraqi”, along with the racial groups “white”, “Black” and “native”. The chart appeared to show that Afghan people were the largest group receiving SNAP benefits, at 45.6 percent, followed by Somali (42.4 percent) and Iraqi (34.8 percent). White people, represented on the chart with the US flag, were third to last at 8.6 percent.
The federal government shutdown, which started on October 1, is the cause of the looming SNAP funding lapse. SNAP provides food purchasing benefits to low-income households. Conservatives have peddled the misleading narrative that Democrats are pushing for healthcare for undocumented migrants, and people commenting on the chart rehashed a similar talking point.
“Who is getting their EBT cut?” read the caption of an October 25 X post sharing the chart, which had 3.1 million views as of October 27. EBT stands for Electronic Benefits Transfer, which is a SNAP payment system.
“Only 18.7% of EBT or food stamp recipients are American. Let that sink in …” read another post sharing the chart, seemingly mistakenly referring to the figure next to the word “Armenian”; there was no “American” category in the chart. “We are subsidizing foreigners on the taxpayers dime.”
Who is getting their EBT cut pic.twitter.com/el8x9X5iVX
— The General (@1776General_) October 25, 2025
The chart doesn’t show the full picture of SNAP recipients by race or ethnicity. The most reliable source for the breakdown of SNAP recipients by demographics comes from the US Department of Agriculture (USDA), which administers the programme.
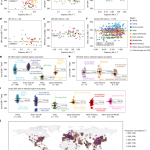
According to the most recent USDA data available, from 2023, white people are the largest racial group receiving SNAP benefits, at 35.4 percent. African Americans are next, making up 25.7 percent of recipients, then Hispanic people at 15.6 percent, Asian people at 3.9 percent, Native Americans at 1.3 percent and multiracial people at 1 percent. The race of 17 percent of participants is unknown.
The same report found that 89.4 percent of SNAP recipients were US-born citizens, meaning less than 11 percent of SNAP participants were foreign-born. Of the latter figure, 6.2 percent were naturalised citizens, 1.1 percent were refugees and 3.3 percent were other noncitizens, including lawful permanent residents and other eligible noncitizens.
While large shares of the groups listed in the chart may receive food stamps, “they are certainly a tiny share of the households and spending on SNAP”, said Tracy Roof, University of Richmond associate professor of political science.
Survey data shows an incomplete picture on SNAP recipients
The chart shared on social media originated from a June blog post from The Personal Finance Wizards, which cited “US Census Table S0201” as its source. The site offers financial advice, but published a disclaimer saying it cannot guarantee the “completeness, accuracy, or reliability” of its information.
The site’s authors appeared to cherry-pick groups to include in the chart, noting, “It’s important to note that the graph highlights a selection of ethnicities we felt would be most relevant and engaging for our audience.” It did not name an author.
In a comment on an Instagram post sharing the chart, Personal Finance Wizards shared a link to the US Census table it used. It shows data from the 2024 American Community Survey, filtered by 49 racial and ethnic groups. The filtered groups don’t completely overlap with the groups in the chart, but the dataset has a column for “households with food stamp/SNAP benefits”, which shows percentages similar to the ones in the chart.
The data does not show what percentage of all SNAP beneficiaries belong to an ethnic or nationality group.
Joseph Llobrera, senior director of research for the food assistance team at the liberal think tank Center on Budget and Policy Priorities, said the chart appeared to show the shares of households receiving SNAP based on the household respondents’ reported ancestry, which is different from citizenship status.
“Without context, this graphic is misleading and may lead some to conclude that many non-citizens are participating in SNAP, which is not true,” he said.
The American Community Survey allows respondents to self-identify their race. It also defines ancestry as a “person’s ethnic origin or descent, roots or heritage, place of birth, or place of parents’ ancestors before their arrival in the United States”.
Colleen Heflin, Syracuse University expert on food insecurity, nutrition and welfare policy, said the American Community Survey data on SNAP receipts is self-reported, and that question “is known to have a great deal of measurement error” when compared with SNAP administrative data.
Chart reflects higher levels of need in groups with higher shares of SNAP participation
Groups such as Afghans and Iraqis, who are first and third on the chart, would have been more likely to have immediately qualified for the SNAP programme before the One Big Beautiful Bill Act’s passage because of their special immigration status.
Before the law’s passage, refugees and people who had been granted asylum were also eligible for SNAP without a waiting period. Somalis, who were second on the chart, are “more likely” to qualify based on those criteria, Roof said.
Other noncitizens, such as lawful permanent residents, could be eligible for SNAP only after a five-year waiting period.
But the passage of the One Big Beautiful Bill Act changed the eligibility, making refugees and asylum seekers ineligible. Immigrants in the country illegally are not and have never been eligible for SNAP.